As part of our filing for Chapter 11 bankruptcy relief, Akamai has acquired select assets from Edgio, including certain customer contracts from our content delivery, applications, and security businesses, but not including Uplynk. We encourage any active Edgio delivery, applications, or security customers that are not already engaged with Akamai to migrate their services, to contact their local Akamai office or support@edg.io as soon as possible to help avoid service interruptions. Service will end on January 15, 2025.
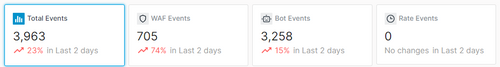
The Total Events view shows consolidated statistics across your entire security configuration. Use this view to identify patterns across your entire security configuration.
WAF Events View #
A WAF event occurs when an access rule, API security configuration, custom rule, or managed rule is violated. It allows you to:
Visualize the time periods during which your site and web applications are most heavily targeted.
Understand the variety, frequency, and severity of illegitimate traffic.
Identify the countries from which illegitimate traffic originates.
Identify key individual offenders by their IP address.
Learn detailed information on the types of attack being mounted against your site.
Click on the WAF Events tab to load this view.
WAF Log Events #
The Log Events section only displays log events for recent access rule, custom rule, or managed rule violations when the WAF Events view is active. View information for a specific rule violation by clicking on it. Log fields are categorized as follows:
A bot event occurs when a bot manager rule is violated. Analyze recently detected bot traffic to
Visualize peak bot traffic time periods and the amount of bot traffic directed at your web application and APIs.
Identify the countries from which bot traffic originates.
Identify key individual offenders by their IP address.
Bot Log Events #
The Log Events section only displays log events for requests that were flagged as bot traffic when the Bot Events view is active. View information for a request identified as bot traffic by clicking on it. Log fields are categorized as follows:
Other Data: Describes the request, the security configuration that was violated, the applied enforcement action, and the edge server on which it was processed.
Key fields when analyzing bot traffic identified through a browser challenge are described below.
Browser Challenge Status (challengeStatus): Indicates the reason why a browser challenge was served. Valid values are:
CHAL_STATUS_NONE: Indicates that a browser challenge was not issued.
CHAL_STATUS_IP_MISMATCH: Indicates that a browser challenge was served due to an invalid token. This status is typically reported when a token is shared or the user’s IP address is modified after the initial token was generated.
CHAL_STATUS_NO_TOKEN: Indicates that a browser challenge was served for a new session.
CHAL_STATUS_TOKEN_CORRUPTED: Indicates that a browser challenge was served due to an invalid token. This status is typically reported when a user agent submits a request that includes a token that our service cannot decrypt.
CHAL_STATUS_TOKEN_EXPIRED: Indicates that a browser challenge was served due to an expired token. This status is typically reported when a user agent (e.g., web browser) submits a request after the expiration of the previously solved browser challenge.
You may configure the duration for which our CDN will serve content to a client that solves a browser challenge without requiring an additional browser challenge through the Security Application’s Valid for (in minutes) option.
CHAL_STATUS_UA_MISMATCH: Indicates that a browser challenge was served due to an invalid token. This status is typically reported when a token is shared with another user agent (e.g., web browser) within the same machine.
CHAL_STATUS_WRONG_ANSWER: Indicates that a browser challenge was served because the user was unable to solve the previous browser challenge. This status may also be reported when the user agent (e.g., web browser) submits a tampered token.
Token Validity Duration (tokenDurationSec): Indicates the number of minutes for which our CDN will serve content to a client that solves a browser challenge without requiring an additional browser challenge.
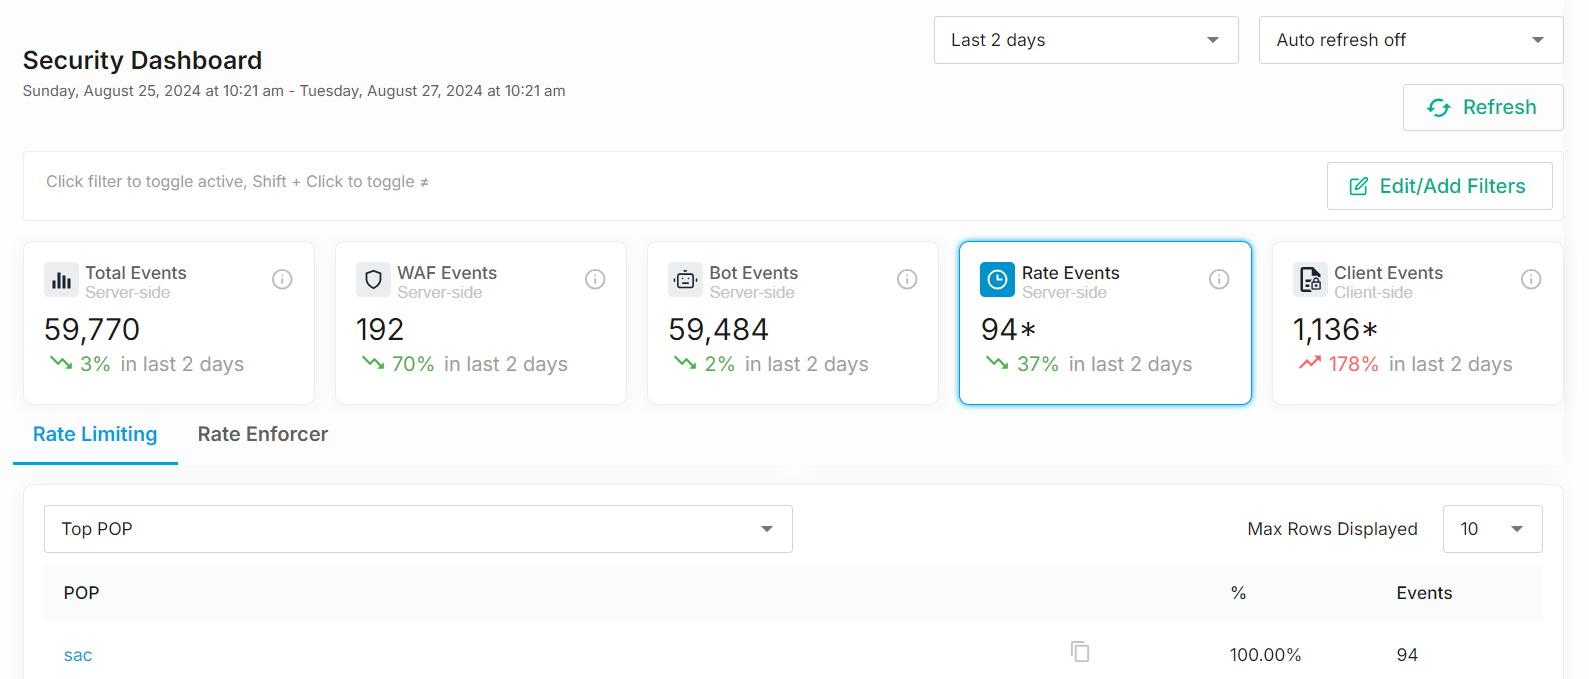
Rate Limiting: Contains statistics for requests that exceed a rate limit.
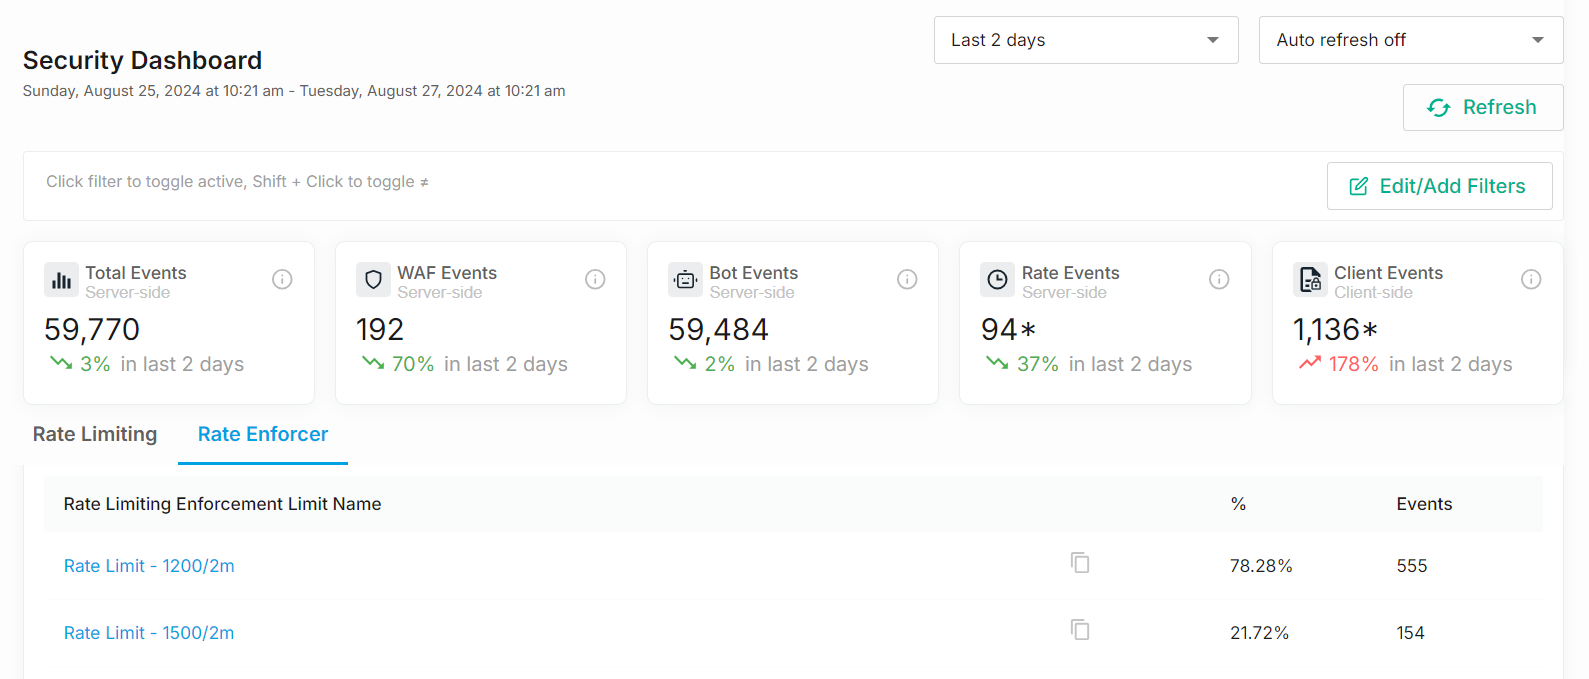
Rate Enforcer Contains statistics for rate limit enforcement events. An enforcement event starts when a rate limit is exceeded. A Security App’s configuration determines the duration for this event.
A rate limit event occurs when a request exceeds a rate limit. Analyze recently rate limited requests to:
Understand the severity of rate limited requests.
Identify the countries from which rate limited traffic originated.
Identify key individual offenders by their IP address.
View detailed information that describes a rate limited request.
Logging for rate limited requests is downsampled to 10% due to the volume of requests that may occur during a single incident (e.g., volumetric Distributed Denial-of-Service attack).
Rate Limit Log Events #
The Log Events section only displays log events for rate limited requests when the Rate Limiting tab of the Rate Events view is active. View information for a specific violation by clicking on it. Log fields are categorized as follows:
Common Headers: Provides key request header data.
Other Data: Describes the request, the security configuration that was violated, the applied enforcement action (actionType), and the edge server on which it was processed.
A rate limit enforcement event identifies each instance that a set of requests exceed a rate limit. This type of event starts when a rate limit is exceeded. The time period defined within a Security App’s Rate Rule tab determines the duration for this event.
Analyze rate limit enforcement events to:
Visualize the time periods during which a high volume of requests resulted in the enforcement of a rate rule.
Understand the frequency of rate limited requests.
The Rate Enforcer tab logs a single event whenever your rate limit threshold is exceeded. This occurs regardless of the number of requests that end up being rate limited as a result of this enforcement.
In this example, you have configured a rate limit of 300 requests per minute with an enforcement duration of 1 minute. Assuming the traffic pattern described below, the Rate Enforcer tab will indicate that 4 events took place.
Time
# of Requests
12:01
300,000
12:03
1,000,000
12:05
800,000
12:07
400,000
Rate Limit Enforcement Log Events #
The Log Events section only displays log events for rate limit enforcement events when the Rate Enforcer tab of the Rate Events view is active. View information on a rate limit enforcement event by clicking on it. For example, view the type of enforcement action (i.e., enforcementEnfType) that was applied to the rate limited requests and the time period (i.e., enforcementStartTimeMs and enforcementDurationSec) during which it was applied.
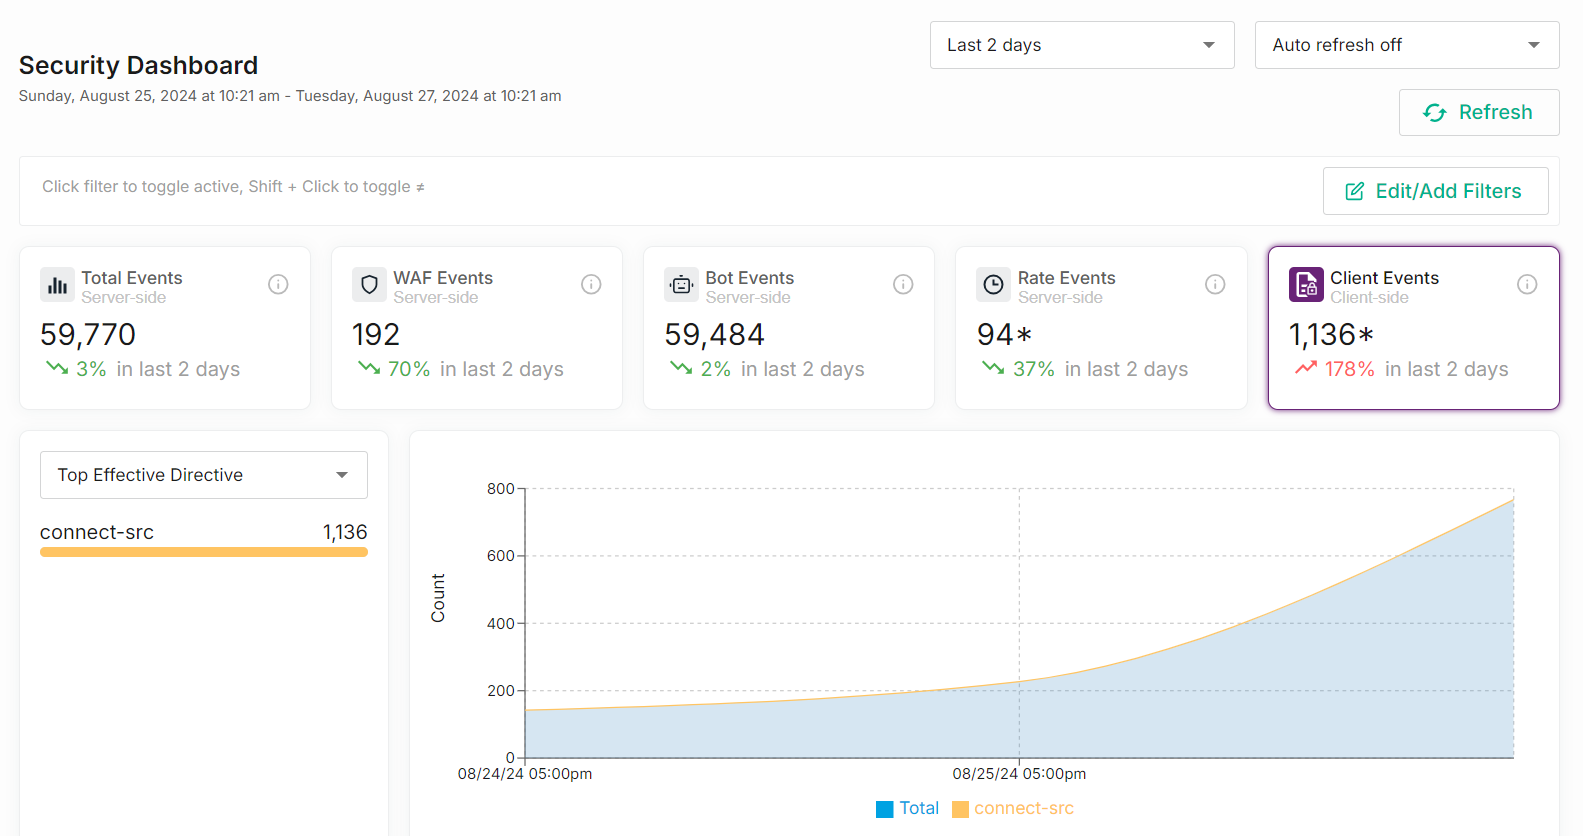
A client event occurs when a Content Security Policy (CSP) defined within a Client-Side Protection configuration has been violated. Analyze these violations to:
Detect Cross-Site Scripting (XSS) attacks.
Identify unsafe practices, such as:
Allowing inline scripts which can allow a bad actor to inject malicious scripts.
Loading resources from unverified or untrusted sources.
Detect unauthorized requests to external domains.
Generate graphs for client events based off of the following metrics: blocked URL, disposition, document domain, document path, effective directive, source file, and status code.
The Log Events section only displays log events for requests violated your Client-Side Protection policy when the Client Events view is active. View key information for a specific violation by clicking on an event:
Blocked Query: The query string defined within the request for the resource that violated your CSP.
Blocked URL: The URL that violated your CSP.
Disposition: Indicates how the violation was handled.
enforce: The client blocked a request that violated your production Client-Side Protection policy.
report: The client allowed the request, but reported the violation of your audit Client-Side Protection policy.
Document Domain: The domain for the document that attempted to load an external resource that violated your CSP.
Document Path: The path for the document that attempted to load an external resource that violated your CSP.
Effective Directive: The CSP directive that was violated.
Source File: The URL for the document that attempted to load an external resource that violated your CSP.
Status Code: The status code for the request that violated your CSP.
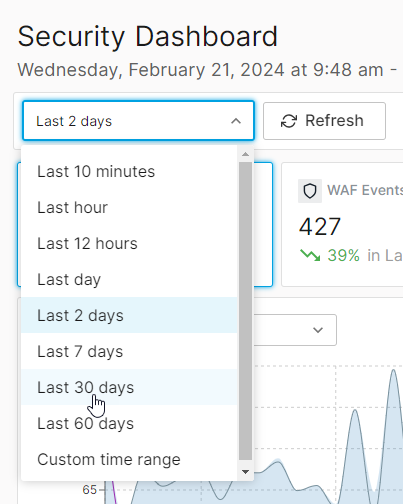
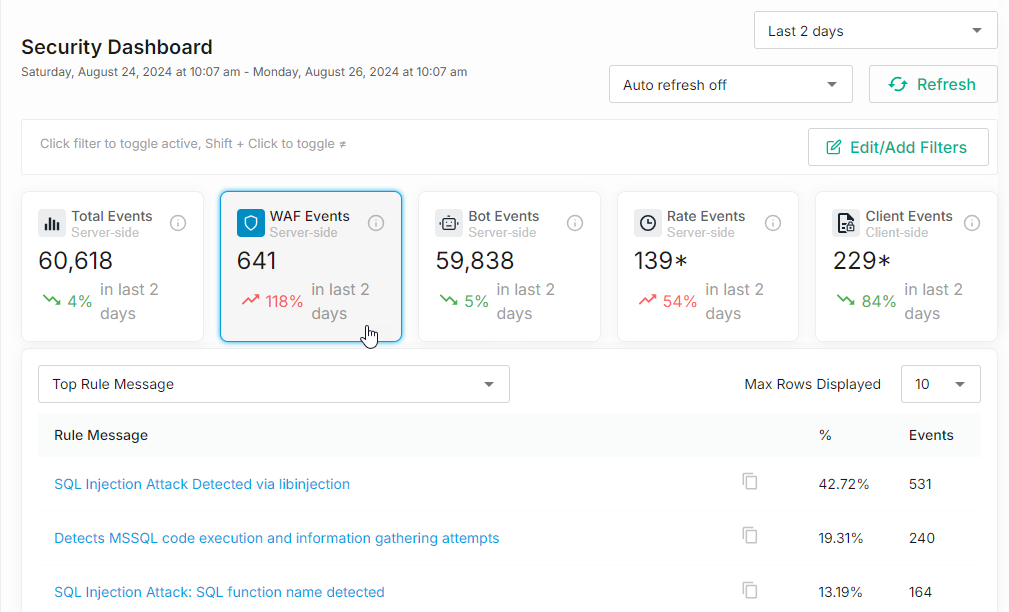
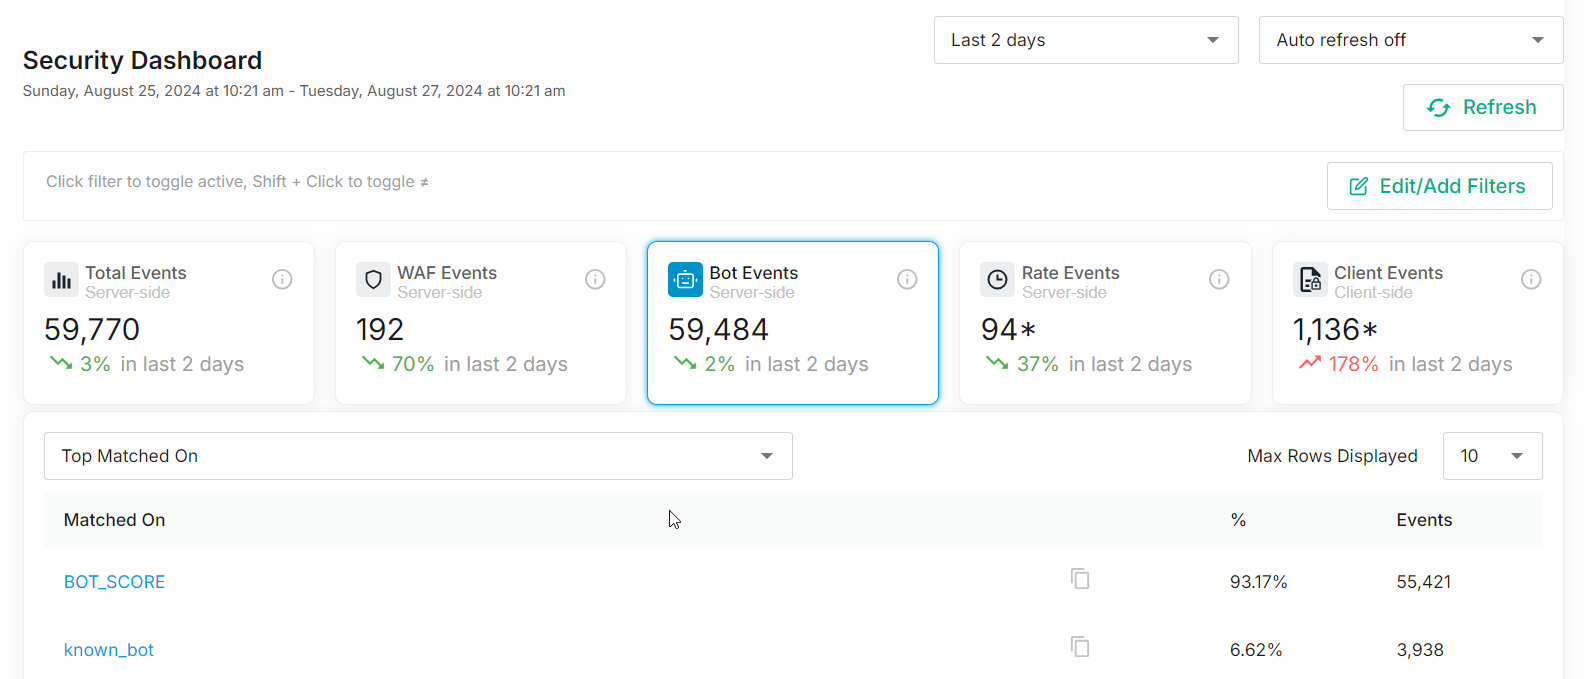
The Security dashboard contains the following components:
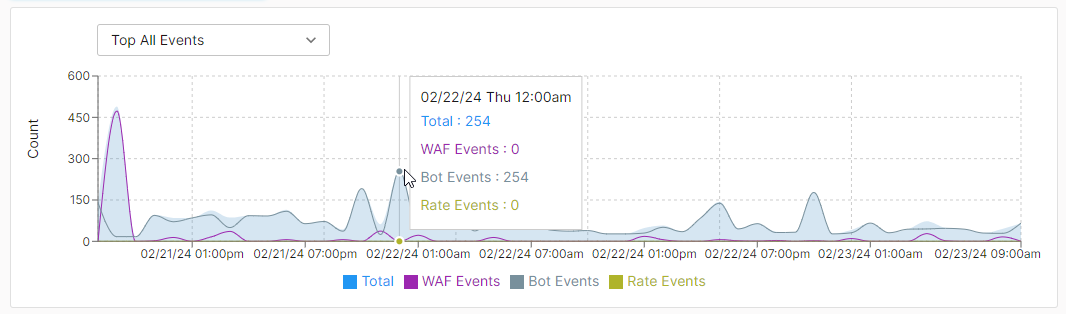
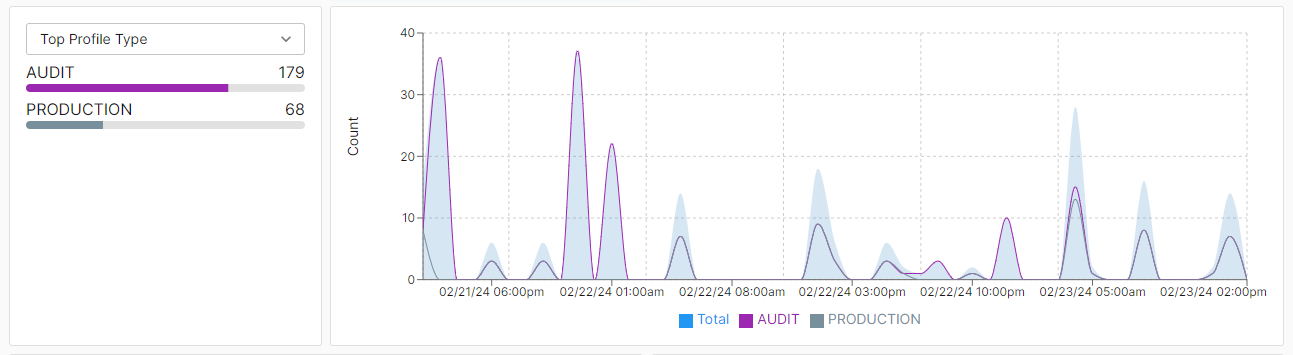
Line Graph: A line graph displays the number of events detected over a given time period.
Key information:
Each line on the graph represents a category of events.
Change the category used to graph lines by selecting it from the option that appears directly to the left of the graph. A line will be drawn on the chart for each unique value.
For example, if you select Top Profile Type and requests were screened by production and audit rules, then the graph will contain a line for audit and another one for production.
By default, graphing events by type will include up to the 10 most popular entries.
Hovering over the line graph will indicate the exact number of violations that took place during that time slot.
Donut Charts / Bar Graphs: Two donut charts are displayed directly below the line graph. These charts break down events by category. Select a category for each donut chart to view statistics for it.
If you prefer to view this data as bar graphs, then click the bar graph icon in the upper-right hand corner of the desired donut chart.
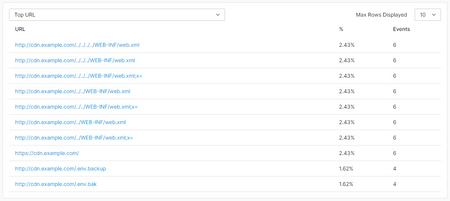
Statistics: Statistics on the events detected over a given time period are displayed directly below the donut charts. Select a category to view statistics for it.
Statistics for up to the 10 most popular entries may be displayed for each category.
The following information is displayed for each category:
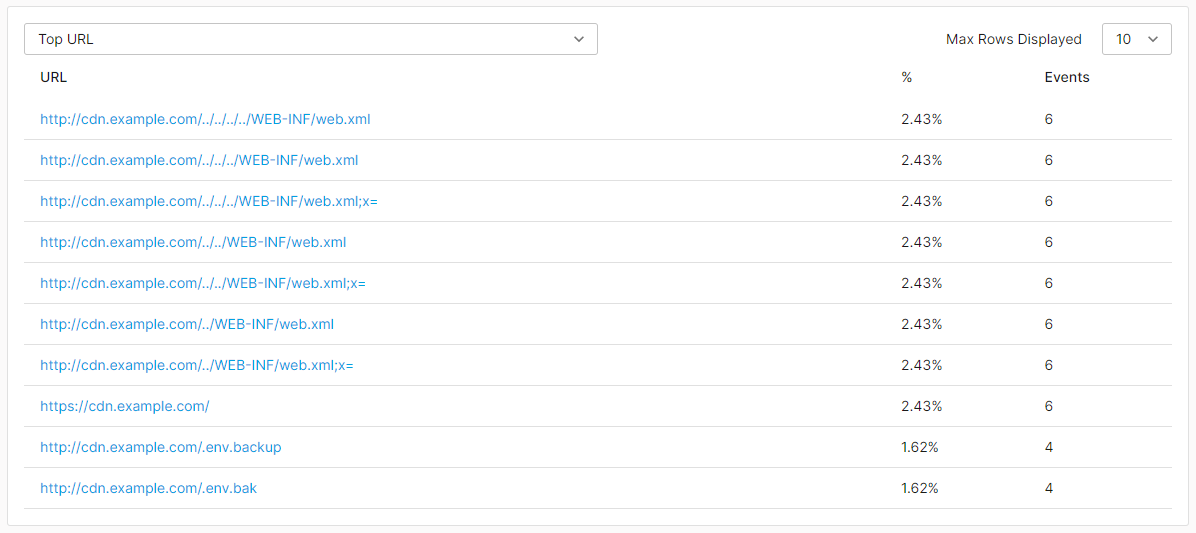
<Value>: Groups events by the request’s value for the current category.
The following illustration shows a partial listing of values for the Rule Message category.
%: Indicates the percentage of detected events over a given time period that belong to the group identified by the Value field.
Percentages are calculated from the total events detected during the given time period. The Max Top Number option determines the limit of entries per category. If the number of entries exceeds this limit, then the sum of the percentages for that category will not add up to 100%.
Events: Indicates the number of detected events that belong to the group identified by the Value field.
Log Data: Paginated log data for the current time period is displayed within the Log Events section at the bottom of the dashboard. Click on a log entry to view detailed information about that event.
Filter the Security dashboard by clicking on a top entry for a particular category or by setting up an advanced filter. The Filters section, which appears on the right-hand side of the dashboard, displays a list of active filters. It also allows a filter to be cleared by clicking on the x (remove) icon displayed next to it.
To apply a filter from the line graph
From the line graph, select the desired category.
Click on the desired entry.
To filter for a specific statistic
From the statistics section, select the desired category.
Click on the desired entry.
To manually define a filter
Click Edit/Add Filters from the upper-right hand corner of the dashboard.
Click + Add Filter.
Select the desired field.
Optional. By default, the dashboard is filtered to find exact matches. Toggle the = to ≠ to filter for events that do not match the specified value.
Type the value by which the dashboard will be filtered.
Click Save.
Click Apply.
To view, modify, enable, disable, or remove active filters
Perform either of the following steps:
Click the desired filter from the top of the dashboard.
Click Edit/Add Filters from the upper-right hand corner of the dashboard.
Perform one of the following steps:
Modify: Click the (Edit) icon next to the desired filter. Make the desired changes and then click Save.
Disable: Click the (Disable) icon next to the desired filter.
Enable: Click the (Enable) icon next to the desired filter.
Edgio provides log data for recent events within the Log Events section of the Security dashboard. Use this log data to analyze specific requests that were flagged as violations of your security configuration.
To view recent event logs
Navigate to the Dashboard page.
From the Edgio Console, select the desired organization.
From the Security section, click Dashboard.
The dashboard displays recent log events for the currently selected view (e.g., Total Events, WAF Events, and Bot Events).
A sub event identifies a rule violation. Each sub event contains the following fields:
Matched On: Indicates a variable that identifies where the violation was found.
Matched Value: Indicates the value of the variable defined by the Matched On field.
Standard security practices dictate that measures should be taken to prevent sensitive data (e.g., credit card information or passwords) from being passed as clear text from the client to your origin server. Another incentive for encrypting sensitive data is that it will be logged by our system when an alert is triggered as a result of this data. If sensitive data cannot be encrypted or obfuscated, then it is strongly recommended to contact our technical customer support to disable logging for the Matched Value field.
Rule ID: Indicates the ID for the rule that the request violated.
Rule Message: Provides a description of the rule that the request violated.
Operator Name: Indicates how the system interpreted the comparison between the Operator Parameter and the Matched Value fields. Common operators are:
BEGINSWITH: Begins with. Identifies a match due to a request element that started with the specified match value.
CONTAINS: Contains. Identifies a match due to a request element that contained the specified match value.
ENDSWITH: Ends with. Identifies a match due to a request element that ended with the specified match value.
STREQ: Exact match. Identifies a match due to a request element that was an exact match to the specified match value.
RX: Regex. Identifies a match due to a request element that satisfied the regular expression defined in the match value.
EQ: Value match. Identifies a match due to a request element
that occurred the exact number of times defined in your custom rule.
IPMATCH: IP Address. Identifies a match due to the request’s IP
address either being contained within an IP block or that was an
exact match to an IP address defined in your custom rule.
Operator Parameter: Indicates the source or the value that was compared against the Matched Value field.
Rule Tags: Indicates the tags associated with the rule that the
request violated. These tags may be used to determine whether a rule,
access control, or global setting was violated.
Naming convention:
<Rule Set>/<Category>/<Subcategory>
<Category> identifies whether the request violated a rule, an access control, or the delivery profile.
Sample values:
Policy: The following sample values identify a policy:
Setting: The following sample values identify a setting:
OWASP_CRS/POLICY/SIZE_LIMIT
Total Anomaly Score: Indicates the anomaly score assigned to the request. This score is determined by the number of rules that were violated and their severity.

 Key information:
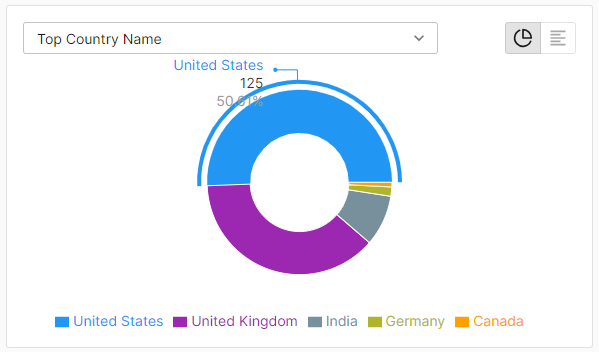 If you prefer to view this data as bar graphs, then click the bar graph icon in the upper-right hand corner of the desired donut chart.
 Statistics for up to the 10 most popular entries may be displayed for each category.The following information is displayed for each category: