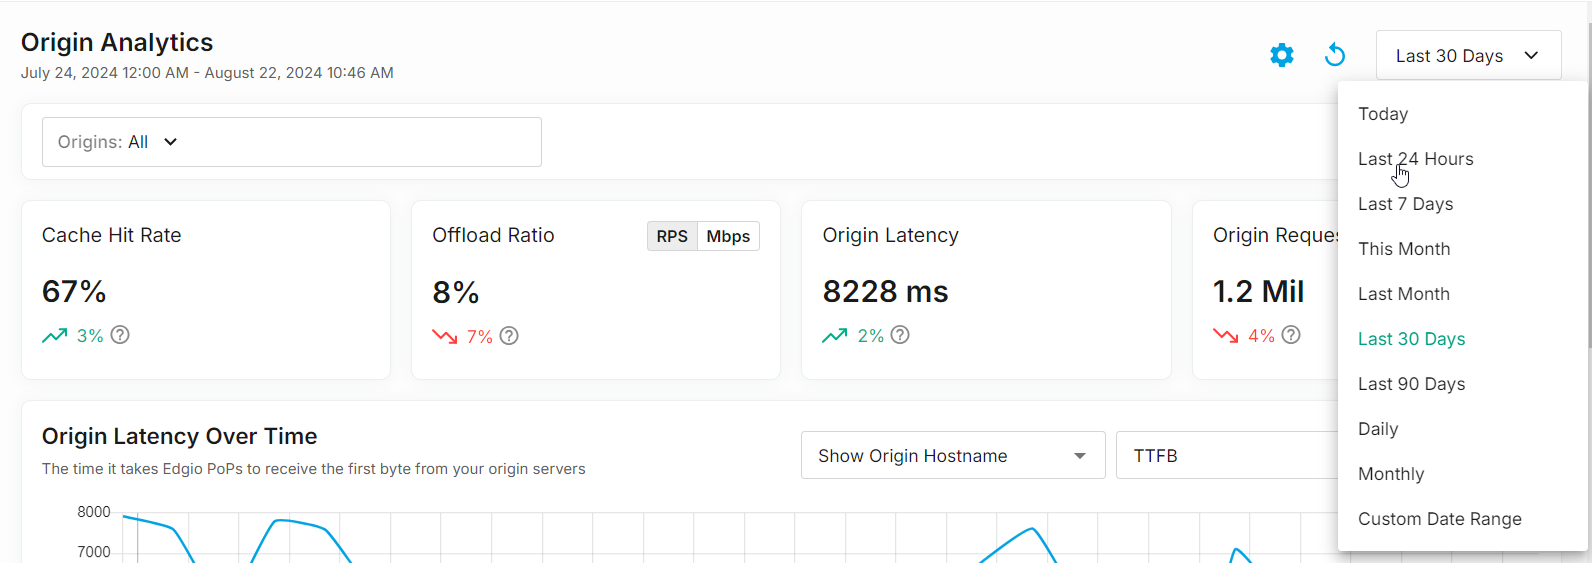
Edgio provides analytics for your origin servers for the purpose of helping you identify origin issues and improve performance. These analytics are provided from within the Origin Analytics page. By default, this page displays analytics for all of your origin configurations over the last 30 days. However, you may filter this page to only display analytics for specific origin configurations or for a different date range.
To view analytics for your origins
-
Load the Origin Analytics page.
- From the Edgio Console, select the desired private space or organization.
- Select the desired property.
- From the left-hand pane, select the desired environment from under the Environments section.
- From the left-hand pane, select Analytics | Origin Analytics.
-
Optional. Filter by one or more origin configuration(s).
- Click on the Origins option.
- Mark each origin configuration for which analytics will be provided.
- Click Update.

-
Optional. Adjust the time period for which analytics will be displayed. From the upper-right hand corner of this page, select a different time period (e.g.,
Today,Last 24 Hours, orLast 7 Days).
Key Metrics
It measures the following key metrics:
- Cache Hit Rate: Indicates the percentage of requests that were served from cache instead of being forwarded to your origin servers.
- Offload Ratio: Indicates either the percentage of requests or the percentage of traffic that was served through your origin servers.
- Origin Latency: Indicates the average amount of time, in milliseconds, that it took for your origin servers to process a request.
- Origin Requests: Indicates the total number of requests that were served from your origin servers.
Graphs
The Origin Analytics page provides the following graphs through which you can analyze origin server performance:
-
Origin Latency Over Time: This graph tracks origin latency over the last 4 weeks.
- Label: Customize whether this graph’s legend displays the hostnames through which requests to your origin are proxied or the name of each origin configuration by selecting either
Show Origin HostnameorShow Origin Name, respectively. - Metric: Choose whether to graph Time To First Byte (TTFB) or the average time it took an origin server to respond to a request by selecting either
TTFBorResponse Time, respectively. - Latency: Choose whether to graph the latency experienced by the average user (P75), the slowest 5% (P95), or the slowest 1% (P99).
- Label: Customize whether this graph’s legend displays the hostnames through which requests to your origin are proxied or the name of each origin configuration by selecting either
-
Origin Requests: This graph tracks the total number of requests proxied to your origins over the last 4 weeks. Each bar is color-coded by class of status code (e.g.,
2xx,4xx, or5xx). You may hide one or more class(es) of status codes by clearing them from the legend that appears directly below the graph. -
Origin Errors: Indicates the number of
4xxand5xxresponses that were generated by your origin servers. Each line is color-coded by status code. You may hide one or more status code(s) by clearing them from the legend that appears directly below the graph. -
Offload Ratio Over Time: This graph tracks either the requests per second (RPS) or the bandwidth (Mbps) sent from your origin servers.