CMCD (Common Media Client Data) is a specification from the WAVE standards project that allows CDN providers to receive player statistics and the requesting object metadata in each HTTP request. See CTA-5004.
In addition to video playback analytics, CMCD data allows Edgio to collect player CMCD metrics with CDN metrics. This data can be used for more real-time action and to troubleshoot and diagnose issues.
If you don’t see the CMCD report listed, contact your account representative.
Architecture
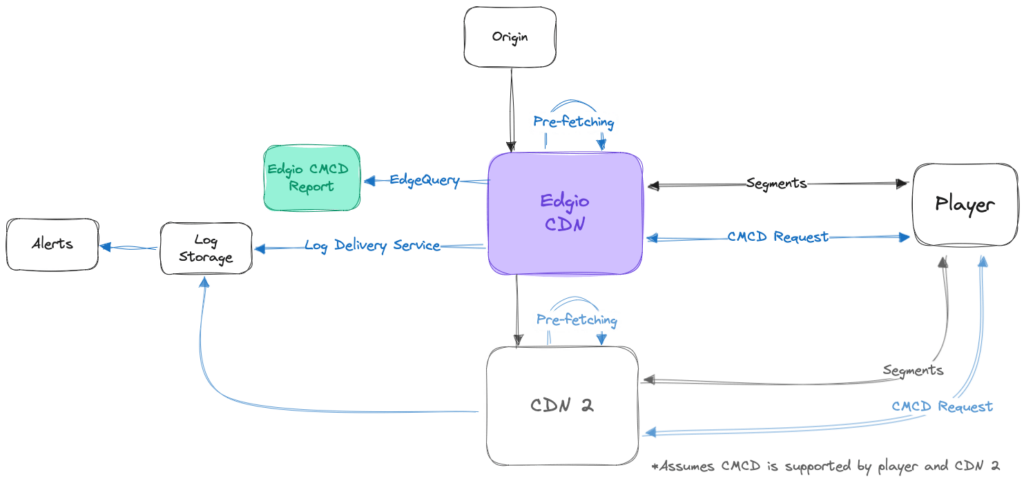
This high-level diagram shows the architecture of a multi-CDN with CMCD:

Data Transmission
Edgio supports all CMCD keys. Keys can be transmitted in three delivery modes from players to CDNs:
- Custom HTTP header in each request. The keys can be used with four header names based on their expected level of variability:.
-
CMCD-Request: Values vary with each request.
-
CMCD-Object: Values vary with the object being requested.
-
CMCD-Status: Values do not vary with every request or object.
-
CMCD-Session: Values are expected not to vary over the life of the session.CORS and content protection introduces extra complexity into CDN configurations. CORS needs to be configured to allow headers to be sent from the player to the CDN.
-
- HTTP query arguments.
- JSON object independent of each HTTP request.
This diagram shows buffer starvation and startup in CMCD format for these transmission modes:

HTTPS is strongly recommended over HTTP for to securely transmit CMCD data over the web.
Enable CMCD Logging
Due to the nature of the CMCD specification, it is essential to enable CMCD logging on both the client and server sides.
Most CDNs and players support CMCD. For example, these players support customer request headers and HTTP query arguments:
- THEOplayer (also supports JSON object delivery)
- Bitmovin
- Shaka Player
- Android ExoPlayer
- hls.js
- dash.js
Client Side
Given the diverse range of players, each with their own CMCD implementation, please consult the player documentation of your choice for instructions on enabling CMCD reporting.
Server Side
For the EdgePrism server, you must configure it to log additional client Request Headers. You can configure through the Control SSUI or request the Edgio team implement the change.
To enable CMCD request header logging in the SSUI, navigate to the OTHERS > Other Options section in the configuration and add (any of) these Header names in the LOG REQ HEADER field:
CMCD-Request, CMCD-Object, CMCD-Status, CMCD-Session or enable CMCD headers by ticking the CMCD HEADER ADD option.Report Specifications

The report has these tabs:
| Specification | Description |
|---|---|
| Latency | Latency depends on the selected granularity. - 5 minutes: 5 to ten minutes - Hour: 1 hour + delta (approximately 5-10 minutes) - Day: 1 day + delta (approximately 5-10 minutes) |
| Granularity | 5 minutes, hour, day |
| Dimensions | Account, Continent, Country, Stream Type, Stream Format |
| Metrics - Summary Area | Vide0 Egress Video Play time Session Rebuffer % Average Client Throughput Average Video Bitrate Slow TTFB |
| Metrics - Elsewhere | Unique session count Session rebuffer % Average Client Throughput Average Video Bitrate Slow TTFB |
| Delivery Mechanism | EdgeQuery |
| Associated API Endpoint(s) | POST /realtime-reporting-api/cmcd returns Realtime Reporting API CMCD data according to parameters passed in request body |
Select Accounts, Date Range, and Time Zones
You can make selections in the controls above the tab header:
-
TRAFFIC FOR. Select one or more accounts to which you have access for cross-account analysis. Click the Select All button to select all accounts.You must select at least one account; otherwise, the default company is automatically selected, and a warning is displayed.
-
Date range. Pick from pre-set time frames or choose custom date ranges in the . Click the Apply button on custom ranges.
-
Time zone. The top five most commonly used timezones in are at the top of the . Scroll down for additional time zones.
Filter Report Data
You can filter report data using filter controls on the Overview, Details, and Geography tabs. You can filter on Continents, Countries, Stream Types, and Stream Formats.
Make the desired selections, then click the Apply button to apply your filter choices.
To reset filters to the default, click the Reset button.
- Filter controls default to All.
- Some filter selections are mutually exclusive. For example, if you select North America as the continent, you cannot select individual countries.
- The Geography tab only contains filter controls for Protocols and Segments.
- Filter selections you make on one tab are automatically applied to other tabs.
- When you make filter selections on a tab then navigate to another tab, then navigate back to the original tab, the selections are preserved in the original tab.
Overview Tab
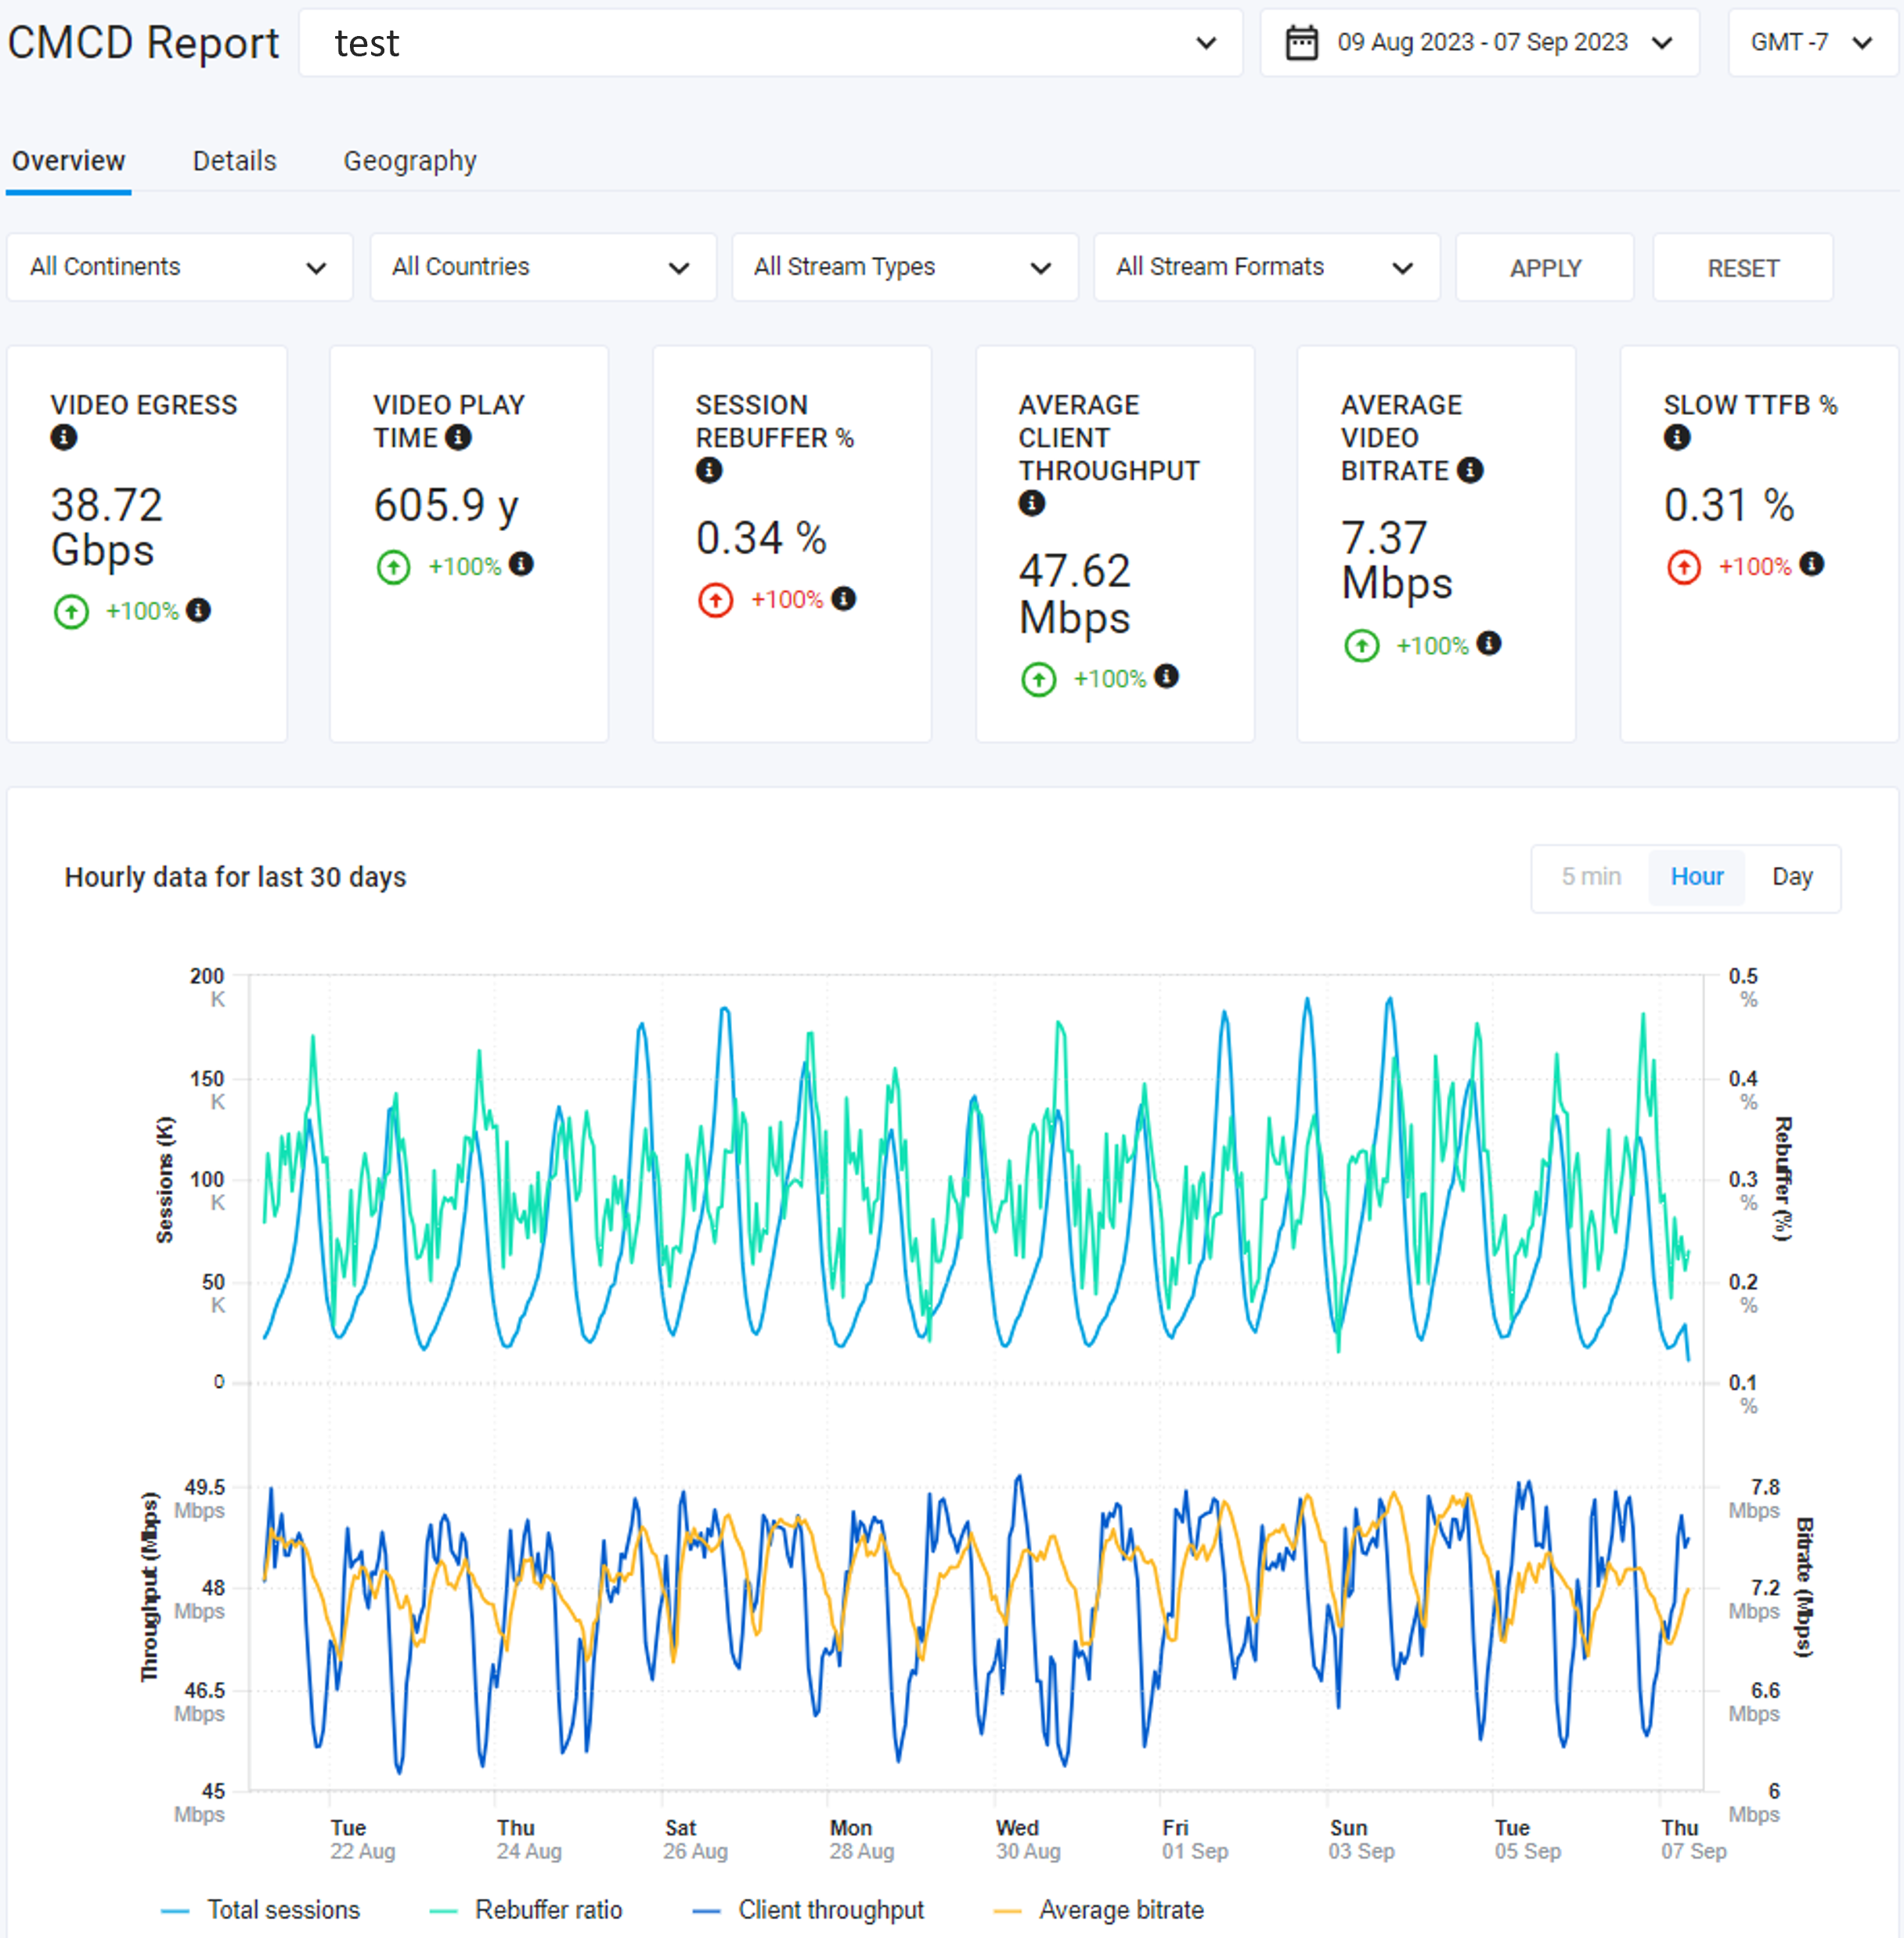
The Overview tab serves as a high-level snapshot of your aggregated data.
Summary Area
For various statistics, the Summary Area shows the percent change for the selected reporting date range relative to the prior time period of the same length. For example, if you select This Month, the statistics show a comparison between this month’s data and the previous month’s.
Colors and arrows represent changes:
- An increase displays in green with an arrow pointing up.
- A decrease displays in red with an arrow pointing down.
- If there was no change from the previous period, the text is gray with an empty circle instead of an arrow.
- Percentage up or down is in bold text to the right of the arrow or empty circle.
- Information in gray text beneath the percentage up or down indicates the total date range covered minus any time remaining in the current period. For example, if you select Last 7 days as the reporting period and the current date is part of the past seven days, the past 13 days’ information is displayed.
Information in the Summary Area depends on the selected accounts, time range, time zone, and dimensions.
Statistics in the Summary Area are:
| Statistic | Unit | Description |
|---|---|---|
| Video Egress | From bps to Gbps | Total Egress for video content only from CDN logs . Video content egress typically ranges between 92%-99% of all CMCD traffic. |
| Video Play Time | From milliseconds to hours | Total video play time from CMCD data |
| Session Rebuffer % | Percent | Percent of sessions with at least one rebuffer to total number of sessions in the given time interval |
| Average Client Throughput | From kbps to Mbps | Average video throughput as reported by CMCD |
| Average Video Bitrate | From kbps to Mbps | Average video bitrate as reported by CMCD |
| Slow TTFB % | Percent | Share of request with Time to First Byte greater/larger than 15 milliseconds, which indicates non-local cache fill on the edge |
Chart
Data is presented in a chart that shows the total throughput of in bytes plus out bytes across the selected date range by default. The label on the left beneath the summary panel reflects the defaults.
Hover the mouse pointer over the chart to view details in tooltips.
Selecting Chart Granularity
You can refine the chart by selecting a granularity value in the toggle above the chart. Toggles are active depending on the reporting date range.
Make a selection in the toggle. The time units on the chart’s X-axis are updated to reflect your selection.
Each value has its own retention policy.
| Granularity | Data Retention Policy |
|---|---|
| 5 min | One week |
| Hour | Five weeks |
| Day | One year |
Toggling Chart Data
A legend below the chart identifies the chart content by color. The legend reflects the choices that you made in the Grouping dropdown menu.
For example, if you Chose Continent in the dropdown menu, data for continents displays in the chart. Labels for the contents are displayed in the chart legend.
The legend labels are toggles that you can use to display or hide the corresponding chart data. By default, all labels are toggled on. Click a label to hide or show the corresponding data in the chart. Labels that are toggled off have a gray font color.
Details Tab
The Details tab allows you to see a unique session per country as well as rebuffer and TTFB percent for a selected time range.
Viewing Details in the Table
The Details tab contains unique session count, rebuffer, and slow TTFB by country.
Sort the data in the table by clicking a column header. When you sort on a field, the sort occurs on all pages of data rather than just the current page.
Geography Tab
The Geography tab shows traffic for your data categories on an interactive map. The map can be used to understand how your audience traffic varies across the world or your chosen continents or countries.
Hover your mouse pointer over a geographical region to view popups with details about
- Total Sessions
- Rebuffer Ratio
- Client Throughput
- Average Video Bitrate
- Average Slow TTFB
Filtering Data
Select the filter control from the on the left above the map:
- Stream Type
- Stream Format
From the top right corner of the chart, you can change the gradient shade of the map by these metrics:
- Client Throughput (default)
- Average Video Bitrate
- Total Sessions
- Average Slow TTFB
- Rebuffer Ratio
Zooming in and out
To zoom in on the chart do either of the following:
- Click the [+] control on the upper left of the map .
- Click a region (continent, country, or state).
To zoom out, do either of the following:
- Click the [-] control on the upper left of the map .
- Click the Continent and Whole World controls on the right above the chart.